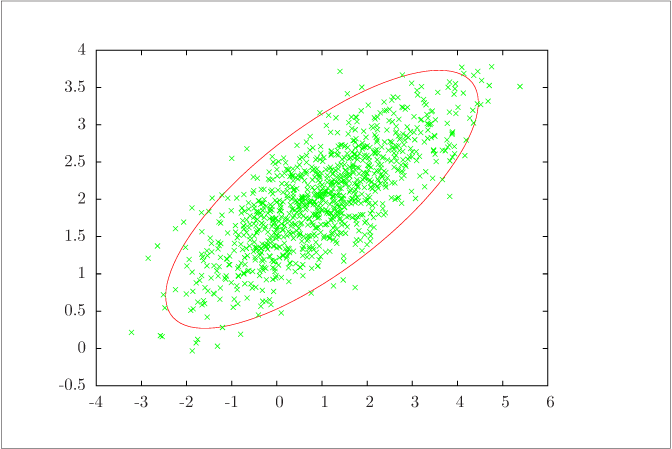
Figure 8 (page 14):
One thousand samples of the random variable x\sim N(m, P) and 95% probability contour.
Code for Figure 8
Text of the GNU GPL.
main.m
clear('all'); close('all');
m = [1;2];
n = length(m);
P = [2, 0.75; 0.75, 0.5];
nsam = 1000;
randn('seed', 0)
% generate the samples
x = repmat(m, 1, nsam) + sqrtm(P)*randn(n,nsam);

% compute the 95% confidence interval ellipse
alpha = 0.95;
A = inv(P);
b = chi2inv(alpha, n);
[xe, ye] = ellipse(A, b, 100, m);

% plot samples and 95% confidence ellipse
plot(x(1,:), x(2,:), 'o', xe, ye)

% count how many samples are outside the  ellipse
e = x - repmat(m, 1, nsam);
sum( diag(e'*A*e)> b )

samtab = x;
eltab = [xe ye];
samtab = x';
save confnorm-ellipse.dat eltab
save confnorm-samples.dat samtab
/export/home/jbraw/courses/cbe255/content/util/common/ellipse.m
%% Copyright (C) 2001, James B. Rawlings and John W. Eaton
%%
%% This program is free software; you can redistribute it and/or
%% modify it under the terms of the GNU General Public License as
%% published by the Free Software Foundation; either version 2, or (at
%% your option) any later version.
%%
%% This program is distributed in the hope that it will be useful, but
%% WITHOUT ANY WARRANTY; without even the implied warranty of
%% MERCHANTABILITY or FITNESS FOR A PARTICULAR PURPOSE.  See the GNU
%% General Public License for more details.
%%
%% You should have received a copy of the GNU General Public License
%% along with this program; see the file COPYING.  If not, write to
%% the Free Software Foundation, 59 Temple Place - Suite 330, Boston,
%% MA 02111-1307, USA.

%% [x, y, major, minor, bbox] = ellipse (amat, level, n, shift)
%%
%% Given a 2x2 matrix, generate ellipse data for plotting.  The
%% arguments N and SHIFT are optional.  If N is an empty matrix, a
%% default value of 100 is used.

function [x, y, major, minor, bbox] = ellipse (amat, level, n, shift)

  if (nargin < 3)
    n = 100;
  end

  if (isempty (n))
    n = 100;
  end

  if (nargin < 4)
    shift = [0, 0];
  end

  ss = size (shift);

  if (any (ss ~= [1, 2]))
    if (ss == [2, 1])
      shift = shift';
    else
      error ('shift must be a 2-element row vector');
    end
  end

  if (nargin > 1)

    [v, l] = eig (amat / level);

    dl = diag(l);
    if (any (imag (dl)) || any (dl <= 0))
      error ('ellipse: amat must be positive definite');
    end

    %% Generate contour data.

    a = 1 / sqrt (l(1,1));
    b = 1 / sqrt (l(2,2));

    t = linspace (0, 2*pi, n)';

    xt = a * cos (t);
    yt = b * sin (t);

    %% Rotate the contours.

    ra = atan2 (v(2,1), v(1,1));

    cos_ra = cos (ra);
    sin_ra = sin (ra);

    x = xt * cos_ra - yt * sin_ra + shift(1);
    y = xt * sin_ra + yt * cos_ra + shift(2);

    %% Endpoints of the major and minor axes.

    minor = (v * diag ([a, b]))';
    major = minor;

    major(2,:) = -major(1,:);
    minor(1,:) = -minor(2,:);

    t = [1; 1] * shift;

    major = major + t;
    minor = minor + t;

    %% Bounding box for the ellipse using magic formula.

    ainv = inv (amat);
    xbox = sqrt (level * ainv(1,1));
    ybox = sqrt (level * ainv(2,2));

    bbox = [xbox ybox; xbox -ybox; -xbox -ybox; -xbox ybox; xbox ybox];

    t = [1; 1; 1; 1; 1] * shift;
    bbox = bbox + t;

  else
    error ('usage: ellipse (amat, level, n, shift)');
  end