clear('all'); close('all');
nsam = 15;
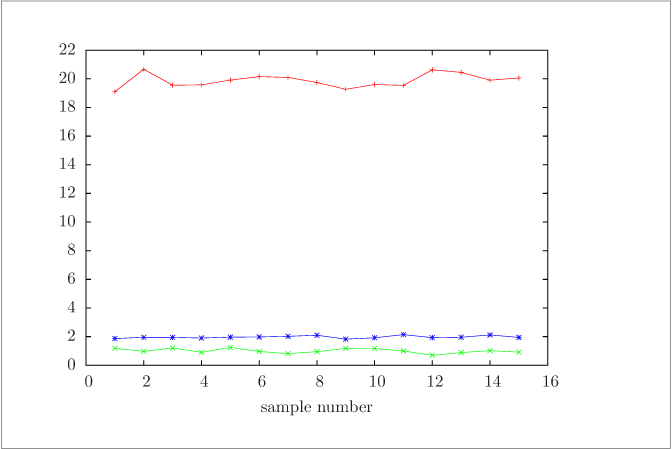
Tsam = 20 + 0.5*randn(nsam,1);
Psam = 1 + 0.2*randn(nsam,1);
Csam = 2 + 0.1*randn(nsam,1);
Measmat = [Tsam, Psam, Csam]
smean = mean(Measmat)
sP = cov(Measmat)
plot(Measmat, '-o')
table = [(1:nsam)', Measmat]
save multisam.dat table